Turning the clock back by 6 months on U.S. stocks…
Many would-be investors are feeling left behind by the U.S. stock market these days.
What if, however, you could turn the clocks back on the U.S. markets by six months? That’s exactly the situation that we have with European markets today.
With U.S. stock markets hitting all-time highs, money is finally moving off the sidelines and into the markets. A good friend of mine has been too scared to get back in the markets for a while. Last week he told me he’s now kicking himself for missing the Trump rally and he’s thinking of getting back in.
It’s a common feeling these days.
For those of you that have been following TradeStops and these editorials, you know that we’ve been reluctant bulls for some time now.
For investors who are feeling left behind and looking for a new opportunity, the U.S. has more risks today than it does rewards. Valuations are very high. Noted economist Robert Schiller, for example, points out that the market is more overvalued than it was at the peak in 2007.
There is a major market, however, that’s looking an awful lot like the U.S. looked six months ago – Europe.
Yes, the European stock markets. The same markets that were devastated by negative interest rates and Brexit. The same ones that have high unemployment, political strife, and terrible banking problems.
We’ve all read about the difficult economic times endured by Europe. But maybe the markets are telling us something that the news won’t tell us. Maybe the worst is over for the European markets and the time is ripe for further growth.
IEV is the ETF for the S&P 350 European Index. It’s traded in the U.S.. It contains stocks from the largest European markets, including the UK, Germany, and France – stocks like Nestle, HSBC Bank, and Royal Dutch Shell.
From the middle of 2014 until early 2016, IEV dropped almost 25%. During that same period, the S&P 500 Index (SPX) was down only 5%. Since then, IEV has moved up 19% while SPX is up 26%. IEV is still down 10% from its high three years ago.
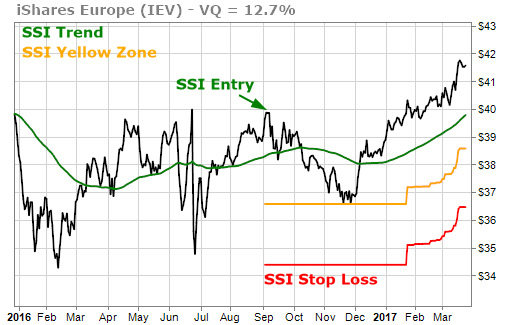
The TradeStops SSI chart on IEV shows that IEV triggered an SSI Entry signal back in the fall of 2016, has a strong uptrend and is making new 12 month highs as we speak.
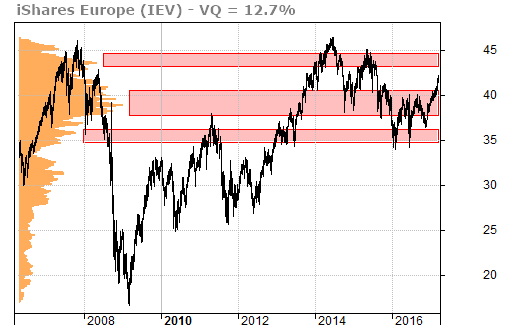
The volume-at-price chart shows IEV has broken above a very strong resistance level. It could move 3-5% higher just on this breakout into the next area of support.
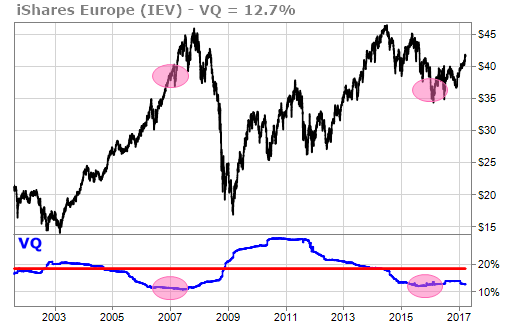
What’s more, the Volatility Quotient (VQ) of IEV looks to be bottoming. Why is this important? Our studies have shown that when the VQ is bottoming and then begins moving higher, this can lead to a bullish move that lasts a year or more.
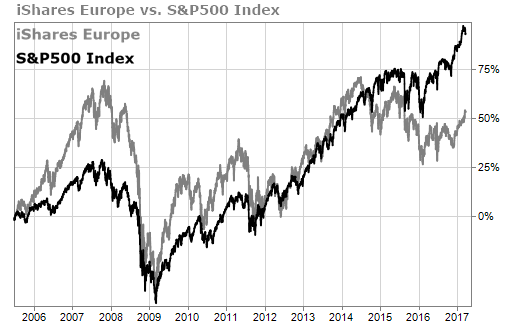
The S&P 350 European Index also tends to correlate positively with the S&P 500 Index. Historically, there are periods when IEV outperformed SPX such as in the two years preceding the financial crisis. Since 2014, SPX has outperformed IEV. It would not be surprising to see IEV “catch up” with SPX over the next few years.
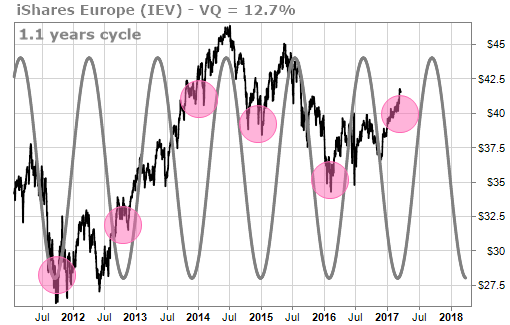
Our favorite long-term time-cycle of IEV is also at its bottom and the path of least resistance is to the upside for the next year.
We don’t believe in crystal balls. But the data tells me the European markets just may have turned the corner. If that’s the case, we could be in for a nice move higher. They have a lot of room to run to catch the S&P 500, but conditions are increasingly favorable for that to happen.
Following the signals, not the fears. It’s not too late to get in. And, you could lead, rather than follow.
TradeSmith Team