Government data breaks the “soft landing” scenario… Treasury yields soar… The yen crumbles… But there’s still plenty of money to be made… In earnings trades, cheap sectors, and more…
If you didn’t… don’t worry. It’s not an easy thing to do. Stocks go up far more often than they go down.
And that’s the lone red coal gleaming out of the ashes of yesterday’s selloff.
Yes, these selloffs are painful. But in hindsight, they always represent big buying opportunities.
Stocks are now, broadly speaking, 5% cheaper than they were just a month ago. It’s a fire sale to take advantage of, and not look back on with regret.
We’ll show you how an analyst in our network is playing the volatility today.
But first, let’s take stock of all the risks at play… and look at some downside levels the market could hit.
❖ Ice-cold GDP, cool consumption, and red-hot inflation are a bad mix…
The quarterly GDP numbers came out yesterday. They showed a quarterly growth reading of 1.6%, well below economist guesses – sorry, “expectations” – of 2.5%.
It seems that, at last, the Fed’s rate-hiking campaign is finally beginning to slow the economy. Previously defying all expectations and driven by a stalwart consumer, the U.S. personal spending number showed cracks in the foundation. Consumption came in at 2.5%, under expectations of 3% quarterly growth.
And to top it off, the core personal consumption expenditures price index – a key inflation metric – accelerated for the first time in a year at 3.7%.
As we’ve showed you before, investors mainly care about how these numbers will guide the Federal Reserve’s interest rate policy.
Lower economic growth would be just fine if we were also seeing lower inflation. But we’re seeing the two diverge, instead.
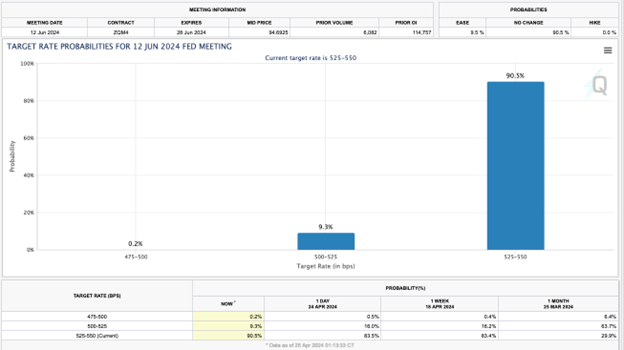
That takes the idea of a rate cut at next week’s FOMC meeting off the table, not that it was anywhere near it to begin with. But now, even the idea of a June cut is becoming untenable. Federal funds futures traders now put the odds of that happening at less than 10%, down from 16% a day ago and almost 64% a month ago:
You have to go out to September to find the first majority consensus of a rate cut, and even that is slim. Odds for the Sept. 18 meeting to result in no change are just under 40%, with a 25-basis-point cut at 46% and a 50-basis-point cut at 14%.
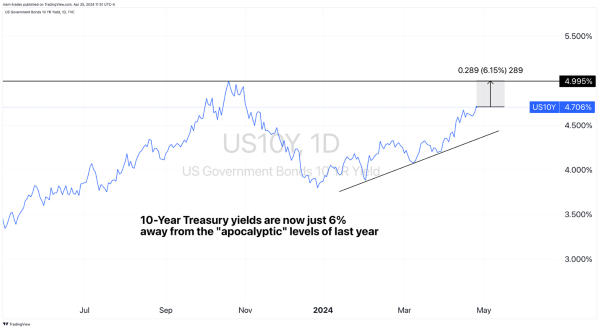
❖ But don’t forget to watch the Treasury yields themselves…
Bond traders are some of the smartest money in the market. Right now, 10-year yields are on the fast track to hitting the “apocalyptic” levels we saw last year.
As long as 10-year yields keep rising, we should take the prospect of near-term Fed rate cuts with a generous handful of salt.
Remember: rising yields are weighing heavily on stocks. But there’s nothing stopping you from taking advantage of them, either.
If you haven’t already, diversify some of your cash holdings into the shorter end of the Treasury curve, where 3-month bills are paying out 5.4% at writing. It’s a good place to hide out while stocks struggle.
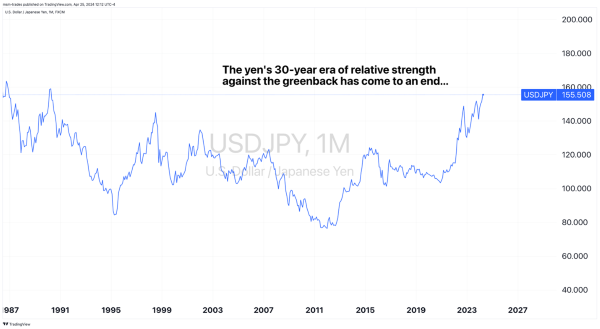
❖ The yen is crumbling, and stomping the brakes on the Japanese stock trade…
The U.S. dollar is at its strongest level against the Japanese yen in 34 years. And that’s far more a testament to the yen’s weakness than it is the dollar’s strength.
Here’s the chart…
The yen is the worst-performing currency year-to-date of the Group of 10 developed economies. Over the longer term, it’s not much prettier. Japanese yen purchasing power has fallen by about 50% in less than 10 years.
Earlier this year, a weaker currency in Japan drove speculation that its stock market would outperform, as Japanese companies’ income earned from outside the country would rise in yen terms.
At the same time, Japanese corporations recently issued the biggest wage hikes in more than 30 years, which investors hoped would encourage spending and drive corporate earnings higher.
Now, though, the weaker yen has crossed a Rubicon of depreciation. If the currency becomes too weak, its consumers will start to feel the pain. They’ll spend less, denting corporate earnings, and unwinding the Japanese stock trade thesis entirely.
The Bank of Japan will issue comments today on whether it will take steps to intervene on the spiraling currency. For the time being, consider trimming any Japanese stock exposure you may have.
❖ Amid all this doom and gloom, a 268% single-day contrarian profit is hard to ignore…
We told you on Wednesday that TSLA was flashing a historical buy signalonly seen four times before. This came after its share price has tanked nearly 50% this year alone, and seven days in a row.
Most investors were looking at its Tuesday earnings report as the final nail in the coffin for the struggling EV maker. But most investors don’t use data to trade – only their emotions.
TradeSmith showed you why TSLA stock is a buy.
But we also have to hand it to Andy and Landon Swan, founders of LikeFolio, who called TSLA’s earnings report as a huge upside opportunity.
In their earnings-trading research advisory, Earnings Season Pass, the brothers recommended getting long TSLA ahead of earnings – based not solely on the company’s fundamentals, forward guidance, or any traditional metric, but something else entirely.
As a result, they helped their subscribers book a 268% return in a single day.
Here’s what Andy Swan said in the recommendation:
With this trade, markets give us a 25% chance of success with a 3:1 reward-to-risk ratio… TSLA stock is beaten down and much of the bad news is priced in. It could rally on a “cover the news” type of report, or if there is any surprise to the numbers. Our data suggests a rally is very likely.
And later on, reviewing the trade with his subscribers…
That Earnings Season Pass alert went out on Monday, April 22, when TSLA shares were hovering at 52-week lows. Tesla reported its numbers Tuesday, April 23, after the bell. The stock rallied more than 12% on earnings. And by 10:00 a.m. today, April 24, our members were walking away with a 268% win.
Let that sink in: +268%. In two days.
What did Andy and Landon see that most investors missed?
The key is in their unique approach to trading – using social media metrics to gauge consumer and investor sentiment all at once.
Here’s Andy with the breakdown:
With direct access to the firehose of consumer conversations happening every minute of every day – mentions from social media platforms such as X and Reddit (RDDT), Google (GOOGL) searches, company web traffic, and more – we have the kind of perspective hedge funds pay top dollar for.
And these three powerful charts paint a clear bullish picture for Tesla that lasts well beyond this short-term earnings rally…
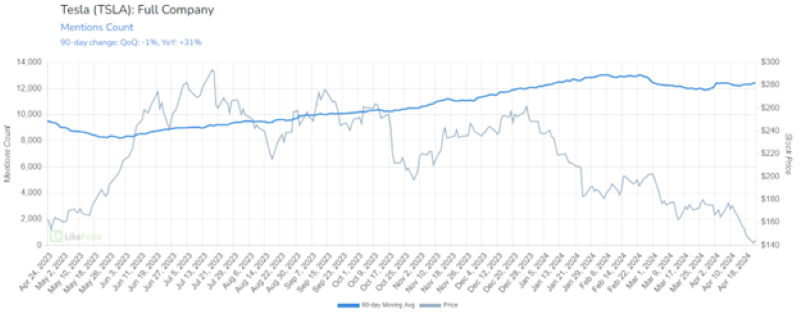
1. Consumer Mentions Show Increasing Divergence:
Divergence in this instance means Tesla buzz is heading higher (+31% year over year) while its stock price trends lower. If history is any indication, this growing gap between stock price and mention volume will likely narrow – and we are betting the stock will follow mentions higher.
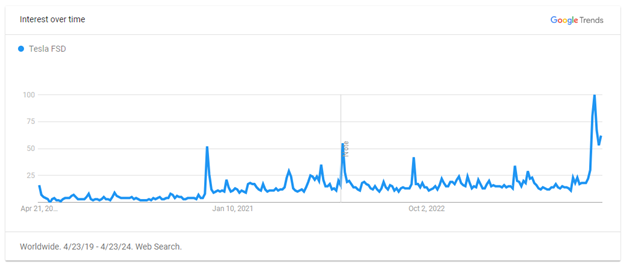
2. Tesla FSD Searches at All-Time Highs:
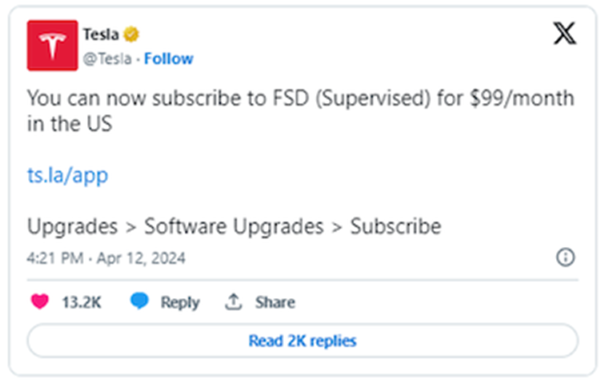
Consumer searches for “Tesla FSD,” its Full Self-Driving feature, hit all-time highs last month as Tesla pushed updates and improvements to its self-driving platform and slashed the price of a monthly subscription in half.
It’s important to note that during this massive adoption of a new and futuristic technology, Tesla sentiment only moved by -3 points. That’s impressive, considering the mention buzz growth displayed above – and bodes well for future FSD upgrades down the road.
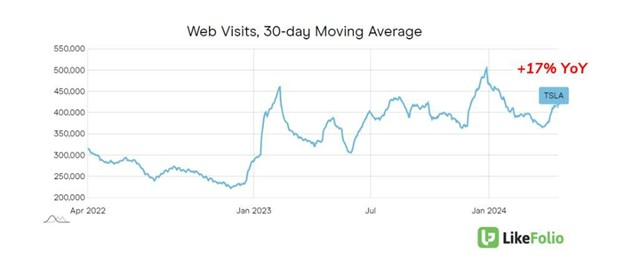
3. TSLA Web Traffic Is Accelerating:
Consumer visits to Tesla’s website to check out its vehicles (and other product offerings) are rising at an increasing rate: +10% year over year on a 90-day moving average and +17% on a 30-day moving average. This is an excellent gauge to use for future purchases.
The takeaway: Trusting the data pays off. While others focused on the noise around Tesla, we tuned into the signal – real, measurable consumer behaviors and trends that foreshadowed Tesla’s rebound.
To be clear, TSLA was just one of the prescient callouts in the weekly Earnings Season Pass report.
Andy and Landon’s analysis also warned of a potential downside surprise out of META, which wound up calling an 11% single-day fall in META stock.
❖ There’s more opportunities on the horizon…
Make sure you tune in to TradeSmith Daily this weekend.
Tomorrow, I’ll share a way for you to take advantage of a ridiculously cheap, free-cash-flow gushing market sector that’s been practically abandoned by Wall Street.
If this week’s volatility has shown us anything, it’s that we need to be selective with our investments. In our view, selecting this one is a wise move… and we’ll share one stock with huge free cash flow yield for your watchlist.
Then on Sunday, make sure to read a brand-new dispatch from our CEO, Keith Kaplan, who for the first time will share his entire investment strategy, top to bottom, with a caveat – that you promise not to copy it.