This Signal Fires Months Before Stocks Move
Listen to the audio version of this article (generated by AI).
Editor’s note: Today, we’re sharing another essay from our corporate partner Marc Chaikin, founder of Chaikin Analytics. More than a decade ago, Marc tried to pull useful signals out of social media chatter about stocks. It didn’t work, so he went back to the rule he’d followed his whole career: Ignore the noise.
Below, he explains what he missed, and how Andy and Landon Swan, the LikeFolio cofounders behind our MegaTrends research, found it.
On Tuesday, Oct. 27, at 1 p.m. ET, Marc and the Swans are hosting The Stock Tsunami Event to show what happens when their two systems line up. Everyone who attends gets three free stock ideas: two urgent buys and one sell that’s even more urgent.
Click here to reserve your spot.
In 2010, my company put a Twitter feed inside an iPhone app for our customers.
It was called Chaikin Power Tools. The app gave users my Power Gauge rating for each stock. The Power Gauge looks at more than 20 factors behind a stock, from its finances to whether big money is flowing in or out and boils them down to ratings of “bullish,” “bearish,” or “neutral.”
Next to each rating, the app also showed how that stock was trending on Twitter. It sounded an alert whenever the chatter spiked.
AI whiz Ben Goertzel conceived and wrote the sentiment work. He’s credited with popularizing the term “artificial general intelligence” – a type of AI that matches or beats humans at every kind of thinking.
I had one of the sharpest minds in AI working on how to find signals in all that Twitter noise, and we still couldn’t figure out how to turn it into profits for investors.
So it never became part of our Power Gauge system. And for the next 16 years, I’ve kept repeating the same mantra: Ignore the noise.
Now, I know now what we got wrong, and it’s the reason I’m writing to you today.
You see, the data I was looking for in 2010 existed. I just wasn’t looking at it… and neither was anyone else on Wall Street. It was hiding in the one place I’d spent decades telling people not to look.
Listening to the Wrong Conversation
Our app tracked Twitter users talking about stocks, which is the same conversation Wall Street has every day.
As it turns out, the real signal was in a different conversation – the one people are having about what they’re buying and thinking of buying… and what they’ll never buy again.
Every day, millions of Americans post about the restaurants they visit, the products they love, and the ones they hate. And in doing so, they reveal their purchases and purchase intent long before that spending shows up in a company’s earnings.
In 2010, nobody was collecting that data in a way investors could use – including my own firm.
But as I learned at an investor conference earlier this year (more on that in a moment), two brothers, Andy and Landon Swan, started building it two years after my attempt.
It’s a proprietary data engine built around a simple idea: People vote with their dollars constantly. And when they post about what they bought or what they’re thinking about buying, you can watch the “vote” happen in real time.
Today, that data engine collects 23.5 terabytes of that kind of data from X, Facebook, Reddit, YouTube, search trends, web traffic, and more. That’s roughly twice the amount of data in the Library of Congress.
Then they use AI to sort the signal from the noise, company by company, which is the step we never figured out.
Some of America’s top hedge funds have paid up to $750,000 a year for access to the results. And it’s no surprise.
This kind of data gives them an “early warning” signal on what Americans are spending their money on. That’s an edge most investors never get to see.
Corporate earnings reports look backward across the past three months. The Swans’ system can help you detect what will go into those reports months in advance.
Tracking What Really Matters
Here’s an example of what I mean…
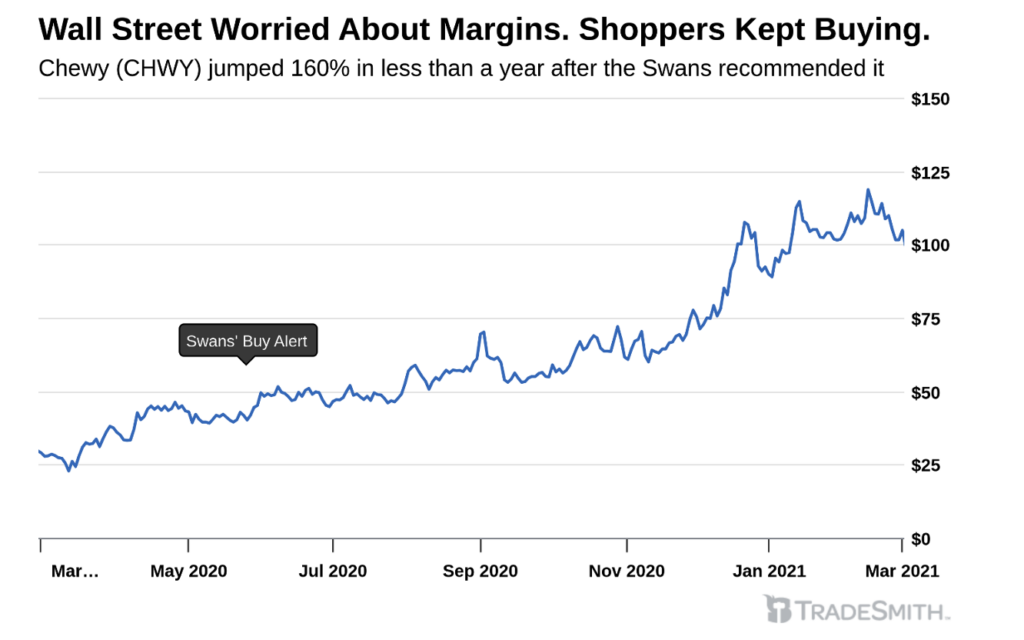
In early 2020, many pet owners stopped walking into Walmart and PetSmart. Instead, they ordered dog food and cat litter online. And in turn, online pet store Chewy’s (CHWY) stock climbed.
Then the analysts weighed in…
Many of them doubted the boom would last. One wrote that the COVID-19 pandemic had been great for Chewy’s demand. But they warned that that the company’s margins would shrink. That pushed the stock lower.
But that was the conversation about the stock. The Swans were listening to the conversation about the product.
Their online consumer sentiment data showed that demand for Chewy’s products had more than tripled. Customers weren’t just buying, either. They were delighted about their purchases – with 85% of the posts about Chewy coming in positive.
The Swans recommended the stock, and it jumped 160% in less than a year. Take a look…
And Chewy wasn’t a one-off. The same data put the Swans’ readers into DraftKings (DKNG) before a 218% gain… Zoom Communications (ZM) before it went up 192%… and Coinbase Global (COIN) before it rose 445%.
In all, they’ve closed 28 trades that doubled or better in the past five years.
So you can imagine how happy I was to cross paths with them in Las Vegas at a recent investor conference.
Finishing What I Started
After they gave a presentation on their work, I recognized the problem they’d solved right away. It was the one my team and I couldn’t solve in 2010.
Their data and my Power Gauge look at completely different things…
The Power Gauge reads financials, earnings, technicals, and what the big money is doing. The Swans’ data tracks what consumers are doing, often long before Wall Street notices.
Think of the Power Gauge system like the buoy near the shore…
It reads how a company’s finances look, how its stock is moving, and whether big institutional money is flowing in or out. From that, the system can tell how large a wave is as it gets close… and its red, yellow and green ratings tell you whether it’s a good time to get in.
The Swans’ data is the sensor on the ocean floor. It picks up the first movement, when people start buying, long before any of that shows up in a company’s numbers.
Put another way, their data sees the demand wave forming – mine confirms the money wave has arrived.
That’s why I’m so excited to be sitting down with Andy and Landon at The Stock Tsunami Event on Tuesday, Oct. 27 at 1 p.m. ET.
We’ll show you what happened when we combined the power of our two systems… why you’ll want to have this research before Nov. 3…. and three free stock ideas as a thank you for joining us: two urgent buys and one even more urgent sell.
In 2010, I had the data and the talent, and I just couldn’t make it work. I don’t intend to let that happen again. And I want to make sure you don’t miss the event, either.
To reserve your spot for our event, RSVP here.
Sincerely,
Marc Chaikin
Founder, Chaikin Analytics