

Listen to the audio version of this article (generated by AI).
Editor’s note: Today, we’re handing the floor to Landon Swan. Landon and his brother, Andy, cofounded LikeFolio, the consumer-data research firm behind our MegaTrends service. Below, Landon explains how childhood trips to a Kentucky racetrack shaped their work, and how it led to their first collaboration with our corporate partner Marc Chaikin, founder of Chaikin Analytics.
On Tuesday, Oct. 27, at 1 p.m. ET, Marc and the Swans are hosting The Stock Tsunami Event. They’ll share the stocks their two systems agree on right now, along with three free stock ideas for attendees: two urgent buys and one even more urgent sell. Click here to reserve your spot.
It all started when I was a kid making $2 bets at Ellis Park.
Ellis Park is tucked into Henderson, Kentucky, just across the Ohio River from Evansville, Indiana, where I grew up. It’s one of the oldest racetracks in America.
Here’s me in a winner’s circle photo from July 21, 1989.
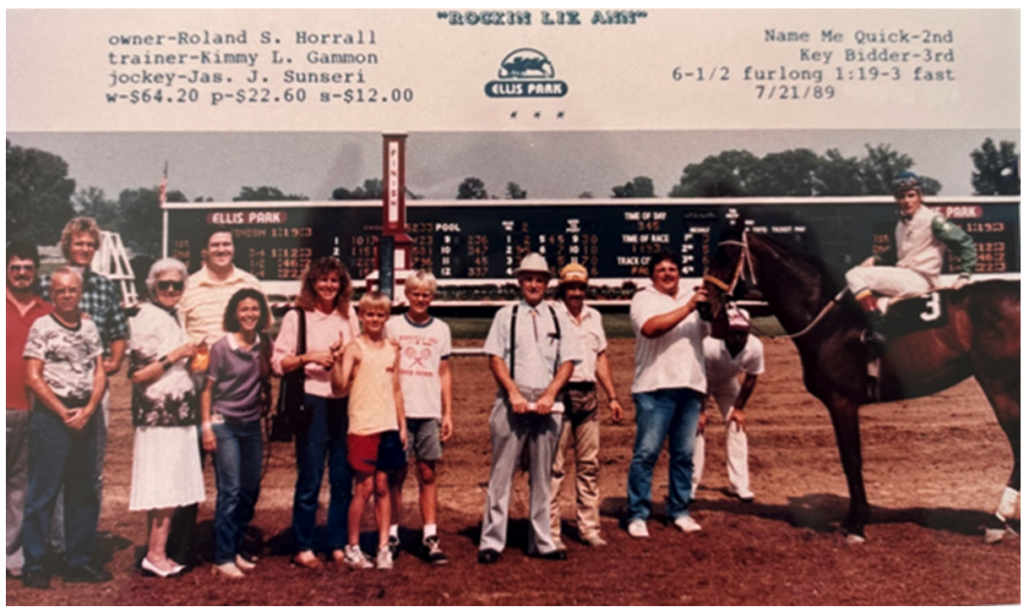
I’m the blond kid in the red shorts, making the “We’re No. 1” sign for the camera. My older brother, Andy, is the tall boy to my left. Mom is behind him. Dad, in the yellow striped sports shirt, towers just off her right shoulder.
And that’s Grandpa Rock in the middle, with the hat, suspenders, and pocket protector. His horse, Rockin Liz Ann, had just won her race.
Grandpa Rock owned thoroughbreds. Some of my best boyhood memories are of the trips we took with him across the river to Ellis Park.
Our parents gave Andy and me $2 each to bet, with one condition. We could choose win, place, or show… but we had to bet on Grandpa’s horse.
Those trips sparked a lifelong love of statistics, probabilities, and forecasting. And as I’ll show you today, that same instinct led us to an edge in the stock market that some of America’s top hedge funds have paid up to $750,000 a year to access.
Now, for the first time, we’ve combined it with the market timing system of a Wall Street legend. (More on him below.) In our testing, when the two systems agreed on a stock, it went on to double or more at its peak 6 out of 10 times.
But first, you need to know where our edge comes from. Because most folks likely aren’t paying attention to it…
The Problem With Earnings Reports
Most folks on Wall Street study earnings reports, analyst notes, and the news. All that information tells you something about what a stock is worth.
But before a company reports a great quarter, people are already buying its products, telling their friends, and searching for it online. The earnings report just confirms what was already happening.
Andy and I wanted to measure that momentum while it was still building. So after working together at TD Ameritrade, we set out on our own. In 2012, we started collecting what millions of Americans post online about the things they buy.
We weren’t interested in selfies or political opinions – that’s just “noise.” Instead, we were looking for purchases or purchase intent.
People vote with their dollars every day. When they post about what they bought, or what they want to buy, you can watch the vote happen in real time… months before it shows up in a company’s official numbers.
Today, our system pulls from X (formerly Twitter), where we’re a preferred partner with direct, real-time access. It also draws on Reddit, YouTube, search trends, web traffic, and app downloads.
All told, we’ve collected 23.5 terabytes of data. That’s roughly double the entire book collection of the Library of Congress.
The hard part is knowing which signals matter. Not every online mention carries the same weight, and not every trend turns into revenue. So we use AI to pick out the consumer behaviors that have historically led to big stock moves… and to spot those patterns much earlier than traditional research can.
Academics at Georgetown University have studied our work. Our research has been cited at Harvard as well. And the results speak for themselves…
Months Before Wall Street Caught On
In early 2020, pet owners stopped walking into Walmart and PetSmart. Instead, they started to order dog food and cat litter online.
That should have been great news for online pet store Chewy (CHWY). And at first, it was.
But many Wall Street analysts doubted the boom would last. One admitted the pandemic had been great for Chewy’s sales… but warned that “a few dynamics” would eat into how much profit it kept from each sale.
Reports like that sent the stock falling.
Our consumer sentiment data revealed something different, though…
Demand for Chewy’s products had more than tripled. And 85% of the posts about the brand were positive. We recommended the stock, and it jumped 160% in less than a year.
Chewy wasn’t a one-off. The same data put our readers into sports betting platform DraftKings (DKNG) before a 218% gain… video-call company Zoom (ZM) before it rose 192%… and crypto exchange Coinbase (COIN) before a 445% run. In all, we’ve closed 28 trades that doubled or better in the past five years.
Still, there was one thing our system couldn’t tell us…
We could see the demand building. But we couldn’t always tell when Wall Street’s big money would finally show up.
That’s where Marc Chaikin comes in…
The Missing Piece From a 60-Year Wall Street Legend
Marc spent decades on Wall Street.
Hundreds of hedge funds, banks, and brokerages still use his first market timing indicator. And his Power Gauge system rates stocks on more than 20 factors, from a company’s finances to whether big institutional money is flowing in or out.
The Power Gauge boils all of that down to a single, actionable rating for each company. It’s “bullish” or better when the overall setup looks strong. And it’s “bearish” or worse when the setup looks bleak.
Andy and I met Marc at an investor conference earlier this year. Marc immediately saw that the data from both of our systems was the perfect combination.
Think of Marc’s Power Gauge as the buoy near the shore. It reads how big a wave is as it gets close. And its ratings tell you whether it’s a good time to get in on it or not.
Our data is the sensor on the ocean floor. It picks up the first movement… the moment people start buying.
The three of us went back and tested every case where both systems agreed on a stock over the past six years. We found 432 of them. In 260, or 6 out of every 10, the stock went on to double or more at its peak.
Our combined systems spotted video game retailer GameStop (GME) after it went viral on Reddit. It went on to soar as high as 7,488%. They also aligned on energy drink maker Celsius (CELH) in early 2020, before it shot up as high as 5,970%.
These are some of the best examples from our backtest, of course. And no system wins every time.
But it’s the kind of edge Andy and I have been chasing since those days at Ellis Park.
What Our Systems Are Flagging Right Now
Right now, both our systems are flagging a new set of stocks. And we want to show you exactly what they are before the crowd catches on.
That’s why Andy and I are joining Marc for our Stock Tsunami Event on Tuesday, Oct. 27, at 1 p.m. ET.
We’ll walk you through the stocks our two systems agree on right now… why you’ll want to have this research before Nov. 3… and three free stock ideas as a “thank you” for joining us: two urgent buys and one even more urgent sell.
Grandpa Rock always made us bet on his horse. This time, we’ve got two systems telling us which ones to back. And I don’t want you to miss out.
To reserve your spot for our event, RSVP here.
Cheers,

Landon Swan
Senior Analyst, TradeSmith
