Your Latest Prescription For Profits In Turbulent Markets
Well folks, the skies are looking clean and clear after the Memorial Day holiday – the S&P 500 notched another new high last week, putting the March selloff in the rearview mirror.
Then again… I think I might see some dark clouds on the horizon.
The stormy threat to the market’s latest parade comes in the form of stock market breadth, an indicator I watch closely – and one which has been very poor on the way to the S&P 500’s latest batch of all-time highs.
I’ve written about market breadth in prior issues of Inside TradeSmith, but today’s case of bad breadth comes from two key points…
First is that the list of individual stocks hitting new lows is expanding, even as the greater S&P 500 Index continues to climb. In fact, when looking at stocks listed on the NYSE, the number of new 1-year lows is 50% above the number of new 1-year highs!
In other words, for every two stocks making new highs recently, there were three stocks making new lows at the same time.
Second, while the S&P 500 as an index is hitting new highs lately, only half of the individual stocks in the index have been above their 50-day moving averages, as you can see in the chart below:
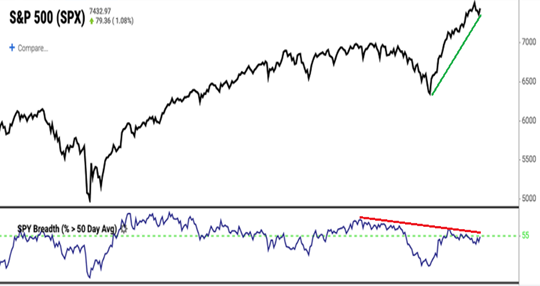
Now, just to be clear, this bad breadth doesn’t necessarily mean that a bear market is around the corner. But it is a warning – a sign that we could expect to see increased market turbulence in the months ahead.
That’s because, historically, when market breadth turns negative while the S&P 500 sits at new highs, stocks tend to struggle in the short-term.
In fact, based on forty years of data, the S&P 500 is up less than 50% of the time in the 3 months following this sort of disconnect between prices and market breadth.
And based on that same data, we can expect the size of average drawdowns over the next 1 to 3 months to come in at about twice the size of the average gains…
So, to sum it up: The hard data tells me that poor market breadth like we have today leads to higher market turbulence and a higher chance of downside risk.
But again – there’s no need to panic!
The good news here is that the best prescription for profits in volatile markets is to get defensive.
For my money, this means picking up quality, low-volatility stocks with plenty of cash flow, since these stocks are less sensitive to the wild market swings we might expect to see in the coming months.
And we can find these newly prescribed stocks with just a few clicks, thanks to our handy TradeSmith Screener tool.
Get Defensive With A Quality Stock Screener
To get started looking for these quality stocks, just log into your TradeSmith Finance Dashboard.
From there, simply click on Invest from the main menu, then select the Screener tab to open our powerful, customizable market-scanning tool.
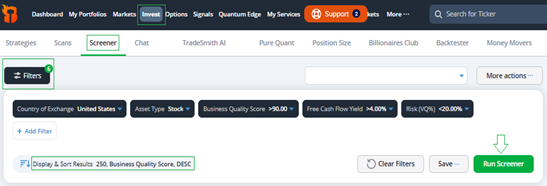
To follow along and build this defensive stock screener for yourself, click on the Filters button to add these options:
- Country of Exchange, set to United States…
- Asset Type, set to search for Stocks…
- Business Quality Score (BQS), set to more than 90% to find only the best stocks in our system, according to TradeSmith’s proprietary grading metrics…
- Free Cash Flow Yield, set to more than 4%…
- And Risk (VQ%), set to less than 20%.
The Business Quality Score (BQS) is our proprietary indicator that measures the worth of a stock based on growth, profitability, safety and payout. High BQS stocks tend to outperform low-quality stocks and hold up best in turbulent markets.
So, in this screener, I filter for BQS > 90, or the top 10% of stocks we rank by quality.
Meanwhile, Free Cash Flow (FCF) Yield is my favorite metric for measuring quality and value. It’s calculated by dividing free cash flow by enterprise value (stock value plus debt).
The S&P 500’s FCF yield is less than 2% today. So, for this screen I insist on stocks with a FCF yield at least twice that, or more than 4%.
And finally, the Volatility Quotient (VQ%) is our proprietary measure of a stock’s volatility. Naturally, lower is better – so for this screen I’m looking for stocks with a VQ% of less than 20, to find stocks in the lowest risk group.
Once you have your filters selected, simply click the green Run Screener to view your results. Also, be sure to click Save to keep this screener for future reference!
When I ran this Screener yesterday, I got 25 non-financial stock results, with the top 10 shown below, sorted by BQS:
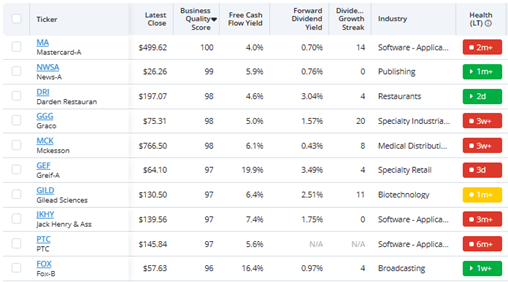
Keep in mind, these filters are fairly restrictive, because I’m looking for only the highest quality defensive stocks in the market.
But you can easily relax some of these filter values to get more results for further research.
And if you decide to add any of these quality stocks to your own portfolio, be sure to get the most out of your TradeSmith tools by syncing your brokerage account with TradeSmith Finance – allowing you to easily track all of your investments, and all of their analytics, in one convenient place.
If you haven’t done so already, you can safely and securely sync your investment portfolio to keep track of the health and performance of every security you own using our flagship TradeStops tool, all with a few clicks.
It’s a quick and effective way to take more control over your finances, and it helps you avoid unnecessary risks. Even if you don’t pick up any of the stocks we found today, it’s a great way to make sure you’re prepared for market volatility.
I covered our Portfolio Syncing tool in detail in a previous issue of Inside TradeSmith. It’s a great how-to resource you can follow step-by-step to easily and safely sync your brokerage account with TradeSmith.
Mike Burnick’s Bottom Line: In my experience, quality, low-risk stocks with strong Free Cash Flow yields are the best prescription for profits when markets get turbulent… and based on the data, turbulence is likely in the months ahead.
Our TradeSmith Screener can quickly and easily help you find stocks to build up your defenses ahead of that volatility – and combining it with a portfolio sync and a quick review of your TradeStops will keep your portfolio in top shape, no matter what happens.
Good investing,
Mike Burnick
Senior Analyst, TradeSmith
P.S. The S&P 500 has been on a tear in recent weeks, but this case of bad breadth isn’t the only thing keeping me cautious at the moment.
With how quickly markets have moved this year, it feels like we’re always one or two bad days – or one bad surprise headline – away from a market-wide shock. We’re barely two months out from the April lows, but things feel increasingly unsteady.
The big question then, is how to prepare for the worst-case scenario… and how to figure out the right time to pull away from the market before the next big decline.
To answer that, TradeSmith has been hard at work powering up our cutting-edge investment software – all to create an early warning system that can help you navigate today’s wild market environment.
TradeSmith’s CEO, Keith Kaplan, spearheaded the development of these “flash-buy” and “flash-sell” signals for months, and what he’s uncovered through the research and development process is critical for every investor who wants to protect their gains as we move into the back half of 2026.
That’s why Keith went live with his special Tipping Point broadcast, to discuss the dangers hiding beneath the surface of the market – and more importantly, to share the innovative solution our team has spent the past year building to help you navigate it.
Click here to watch Keith’s broadcast for yourself.
The early-warning system he’s about to show you could be the single most important improvement we’ve ever made to our investment technology… and with some of the same warning signs we saw before the 2022 crash flashing again, it’s a broadcast you won’t want to miss.