Your Second “Lesson” in TradeSmith: Finding New Investment Ideas
There’s an old saying on Wall Street: “Cut your losses, and your winners will take care of themselves.”
In my first year working as a trader, I heard the saying often… but I didn’t quite understand the meaning behind those words.
And I admit, at the time I didn’t dwell on it much. I was more interested in the fun parts of trading: namely, finding new opportunities to profit!
I had to learn the meaning for myself… and when I did, I learned the hard way. So, let me save you decades of experience – and plenty of lost money.
To sum it up: “Always know your exit strategy – before you place a trade!”
In last week’s issue of Inside TradeSmith, we started our multi-part “TradeSmith 101” series, to cover all the software, tools, and features we have to offer.
By starting things off with a crash course on TradeStops, we’ve made sure that you’re better prepared than I was when I got started, all those decades ago.
Once your brokerage portfolio(s) are securely synced with TradeSmith Finance, TradeStops helps you stay disciplined by placing protective stops and alerts on every security you own.
And our easy to follow Health Indicator – with its Green-Yellow-Red coding system – gives you an objective, data-driven assessment of any security in our database.
Now, with exit strategies securely in place, we can turn our attention back to the fun parts of investing… without needing to learn any hard lessons first.
That’s why in today’s issue, we’ll take a look at the ways TradeSmith can help you find new opportunities to profit across the market. We’ve got you covered there, all thanks to our Trade360 tools – which bundle together TradeStops, our Ideas Lab Strategies, and more.
I’ll walk you through it, step by step.
Step 1: Assess The Market’s Health!
Before considering any new investments, you should do a quick market checkup first.
What’s the current market climate and trend? Are things healthy, with prices moving consistently higher… or are markets looking unhealthy and moving lower?
TradeSmith’s tools and strategies can be used in any market environment. But like it or not, most stocks are going to broadly follow the trend of the overall market, either up or down.
That brings to mind another old Wall Street adage: “Don’t fight the tape.”
Back in the olden days, the now antiquated “ticker tape” that stock transactions used to be printed on was said to reveal the market’s trend. If you could read it, you could read the whole market… so they said.
Today, the market’s trend is determined by technical indicators – and lots of high-tech data analysis along with it. But the moral of the story is the same: For best results, it helps to invest along with the market’s trend.
That means our first stop for today will be the Markets page on TradeSmith Finance, to take a look at our Short- and Long-Term Health Indicators.
As mentioned last week, the TradeSmith Health Indicators help you quickly gauge how major markets, sectors and securities are performing:
- The Short-Term (ST) Health Indicator focuses on trends that typically last less than three months, though some can extend longer.
- The Long-Term (LT) Health Indicator reflects the health and trend of any security with a time frame of 12 months or longer.
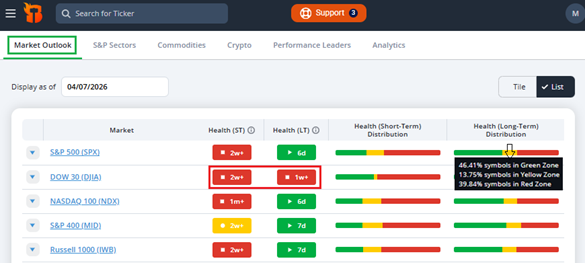
To take a glance at how healthy markets are – or aren’t! – Simply click on Markets from the main menu of TradeSmith Finance. Then select the Market Outlook tab to quickly assess the health and trend of the major U.S. stock markets, as well as the major international markets we follow:
Note: Your available tabs and pages will vary depending on your subscription. If you don’t see a specific tab when you log into TradeSmith Finance – and would like to – please call us at 888-623-0858 to find out how to get access.
As shown above, the S&P 500 (SPX), Dow 30 (DIA), Nasdaq 100 (NDX), and several other indexes entered the Short-Term Health Red Zone, all within the past month.
This means these markets activated short-term “flash sell” signals, with a negative outlook over the next few months. As we look for new opportunities, we’ll need to keep that in mind.
That said, it’s important to note that only DIA has fallen into the Long-Term Health Red Zone. SPX and NDX remain in the Green Zone – with their longer-term trends still stable.
The Health Distribution for each index is displayed to the right of these Health ratings.
Simply hover your mouse over these bars to see how the component stocks of each market are distributed between the Green, Yellow and Red Zones.
As a reminder, here’s what each Health grade means:
- GREEN means buy; the asset is in a healthy long-term uptrend.
- YELLOW indicates caution; the asset’s trend may be changing.
- RED means exit; the stock’s trend has turned down.
The more Green symbols you see relative to Red, the healthier the trend of a market – or a sector. And by clicking the S&P Sectors or Commodities tabs on this page, you can review similar Health data for these categories as well.
And building on the TradeSmith Health Indicator, our Bull and Bear Market signals can warn you of changes in market trends in advance.
Simply click on the ticker of any index on the Market Outlook page to view recent signals, derived from each market’s health distribution:
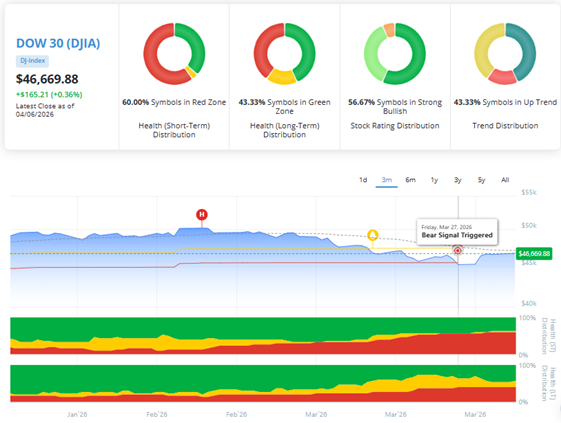
For instance, you can see above that DIA just flashed a Bear Market signal on March 27, 2026. That means more downside is possible for the Dow 30.
To learn more about how to assess the health of the markets, CLICK HERE.
Step 2: Find New Opportunities With Trade360!
Even in the volatile markets we’re experiencing today, there are always new opportunities to take advantage of. And by using the exclusive Strategies from the Ideas by TradeSmith Ideas Lab, you can invest like top hedge fund billionaires.
Aim to earn extra income with our dividend-growth strategy…
Uncover stocks with the potential to surge higher in price…
These are just a few of the investment opportunities you can uncover every day with TradeSmith tools.
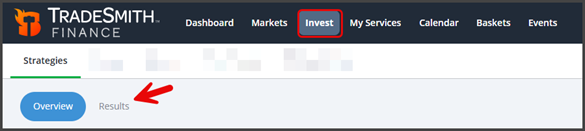
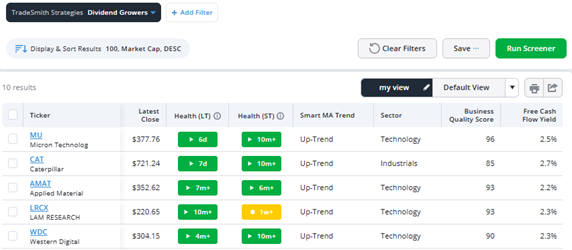
To access the Ideas Lab Strategies, click on the Invest page from the TradeSmith Finance main menu, then select the Strategies tab:
The windows on this page provide top-performing securities that qualify for a variety of our data-driven investment strategies.
Whether you’re aiming for growth, income, or value, you’ll find a variety of trading and investment ideas to match your own goals.
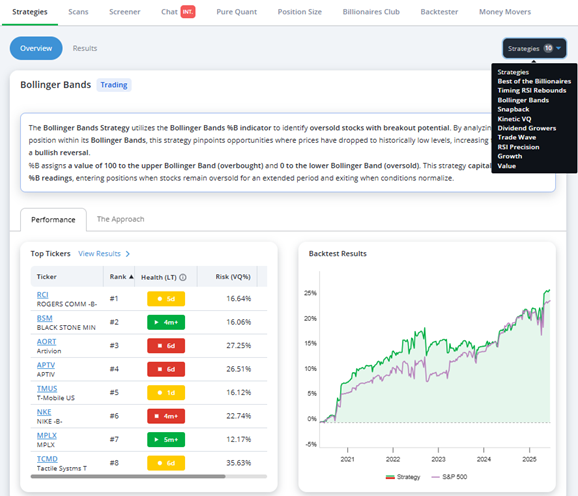
The Overviewtab on this page provides a description for each strategy, including its approach, the top tickers that qualify, backtest results, and details on who should consider each strategy and when to buy and sell.
Simply scroll down the page to view each strategy. Or if you’re looking for a specific strategy, simply click on the Strategies dropdown at the upper right to choose which specific windows to view…
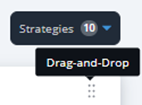
You can also rearrange them using the drag-and-drop icon to customize your view. Just keep in mind that your available strategies will vary depending on your subscription level. No matter which strategies you have access to, however, you can easily view all the ticker symbols that qualify for each Strategy by clicking on the Results tab:
You can also click on any ticker from the Strategy list to be taken directly to the Asset Details page for that security, as you can see below:
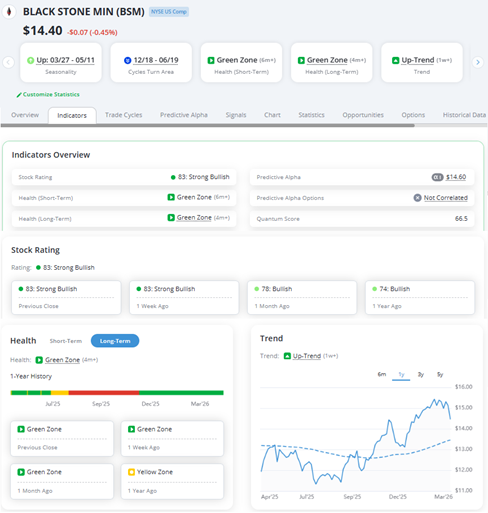
This page provides you with even more TradeSmith data and analysis for that security – along with tabs for specific indicators you may have access to.
To learn more about the Strategies page, CLICK HERE.
Mike Burnick’s Bottom Line: Trade360 and Ideas by TradeSmith deliver a powerful bundle of market data, indicators and our proven Strategies – all designed to help you spot new trading and investment opportunities, no matter the market environment.
In our next “TradeSmith 101” class, I’ll cover how to search for new investment and trading ideas with our exclusive TradeSmith Screener tool. See you then!
Good investing,

Mike Burnick
Senior Analyst, TradeSmith
P.S. We have put in a lot of work into our tools, algorithms, systems, and services of the past 21 years of TradeSmith. And we are always looking to improve what we have – and if there’s something we don’t have, we create it.
In fact, our team is hard at work prepping for our next big breakthrough…
And it all boils down to a powerful new application of AI.
I can’t say a whole lot more because we’re keeping this tightly under wraps…
But imagine knowing exactly how much money you could make on any given trade… how long the trade will likely last, and even the historical success rate.
All before you invest a penny.
I’ll put a pin in that for now, but make sure you stay tuned.