

The countdown to Christmas is underway. And initial data shows two major retailers are leading the pack. Even though earnings aren’t expected any time soon, an early review of near-term performance shows how four major retailers stack up:
- Walmart (WMT): +35
- Costco (COST): +26
- Target (TGT): +12
- Amazon (AMZN): +7
The higher the score, the more bullish the data leans. The lower the score, the more bearish the data leans. (Note: This is on a scale of -100 to +100.)
Each LikeFolio metric (Buzz, Demand, and Happiness), alongside company-specific confidence metrics, informs this score.
So what is driving Walmart and Costco scores so much higher?
1. Walmart and Costco are generating higher seasonal buzz growth
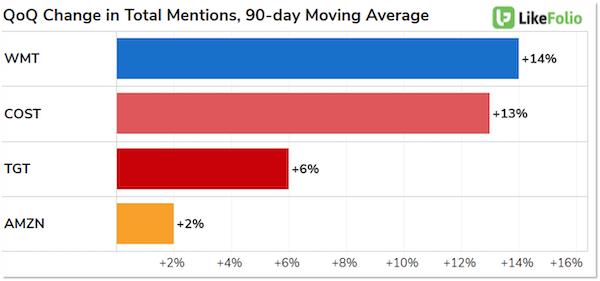
While we would expect improved performance from each retailer into the holiday season, Walmart and Costco are making more meaningful strides versus last quarter.
Last quarter, Walmart beat market expectations and raised guidance, but shares traded lower due to lower profit margins resulting from the retailer’s desire to keep prices low and competitive for consumers.
Costco fared better in the eyes of investors following its most recent report, with shares trading +6% higher.
But this chart gives insight into one of the top questions on investors’ minds… We know consumers are shopping more this season. And based on other data, we also know they began shopping earlier in 2021, anticipating supply chain and delivery challenges.
According to LikeFolio data, buzz for these retailers is still building on top of the prior quarter, but some companies are harnessing more consumer attention than others.
2. Walmart and Costco are making the most significant happiness improvements
To be fair, Walmart’s overall level of consumer happiness is the lowest versus all peers, near 54% positive… but this is a 9-percentage-point improvement versus last year.
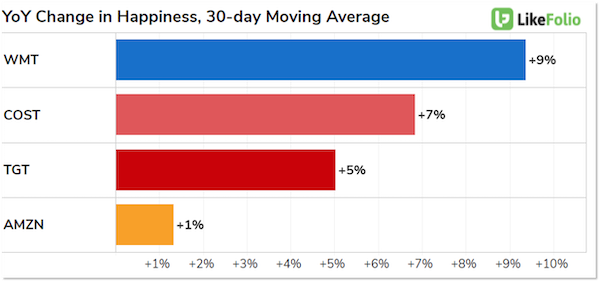
Costco and Target are both recording significant happiness improvements, while Amazon remains mostly flat.
Happiness tends to be very forward-looking, so this is a strong indicator of consumer retention.
We’ll be monitoring these metrics over the next few weeks as last-minute shoppers pull the trigger.
But so far, consumer demand continues to show strength across the retail segment.
Megan Brantley
Head of Research, LikeFolio