How to Stay in Sync with Shifting Market Trends!
And just like that, the nine-week rally in the S&P 500 has come to a dramatic end.
Though to be more accurate to last week, it’s more like the index hit a brick wall of tech sector selling…
Whatever you call it, the S&P 500 dropped 2.6% last week, with the index seeing most of the downside on Friday. Simultaneously, the tech-heavy Nasdaq 100 Index fell even harder, dropping by 4.8% – dragged down by overbought semiconductor stocks.
On top of that, a combination of renewed inflation concerns and better-than-expected economic data have convinced markets that the Federal Reserve is about to make an about-face on policy: If that hunch is right, it means the Fed is about to start raising short-term interest rates again, rather than implementing new cuts as hoped.
Whether that comes to pass remains to be seen… but we should know soon enough, with the next Fed policy meeting just a few weeks away.
In the meantime, though, it just became much more stressful to be invested in stocks…
Thankfully, TradeSmith’s tools are here to help. In today’s issue, we’ll take a look a few trend forecasts from your TradeSmith Finance platform – and I’ll fill you in on one great way to manage whatever the market has in store for us… all in just a few clicks!
But before we get into it, make sure you’re signed up for your next Inside TradeSmith webinar…
This Week: Your Next TradeSmith Walkthrough Webinar!
We’ve got plenty to cover in today’s issue – but there’s even more to learn later this week. Mark your calendars, because your next TradeSmith Walkthrough webinar is coming in just a few days!
This Thursday, June 11, at 1:00 p.m. Eastern, join me and the TradeSmith Education Team for an inside look at the latest enhancements across the TradeSmith platform.
I’ll walk you through new updates to Quantum Edge Pro and Signals by TradeSmith, highlight the latest updates to the TradeSmith Screener tool, and demonstrate a practical screening strategy you can use to uncover real trading opportunities.
And be sure to stay for the live Q&A, where you can get your questions answered by me and the team.
Click here to register for Thursday’s webinar. I hope to see you there!
Following Up On Today’s Market Trends
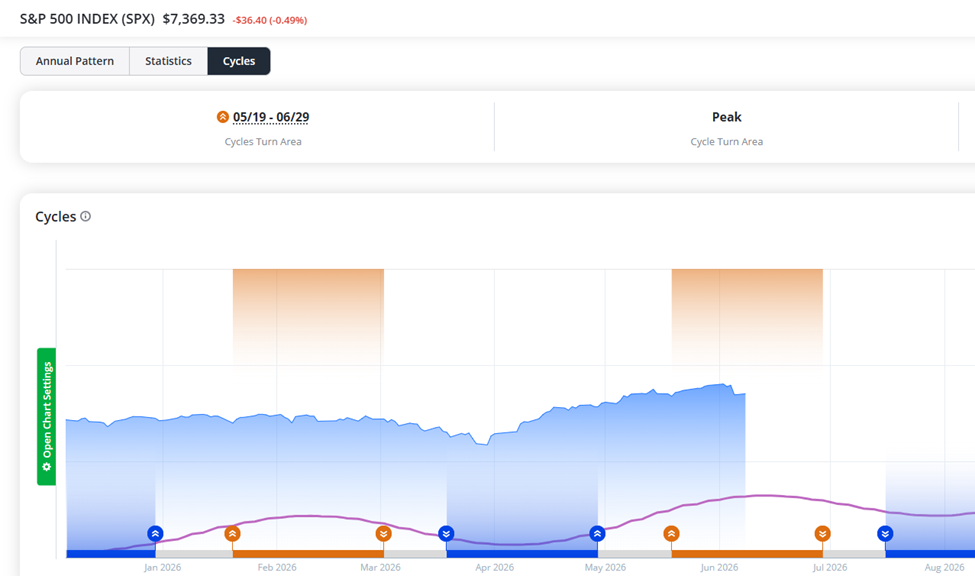
Just last week, I pointed out a series of caution signals cropping up for the S&P 500: According to our Trade Cycles timing tools, the index is now in the middle of a Peak area (the orange-shaded area below) set to run until the end of June.
That means we could expect further downside in the weeks ahead:
Now, that’s not to say we’re guaranteed to see rough days ahead – just that the seasonal trend is bearish at the moment. However, when we take a look at the S&P 500’s Trend on the index’s Asset Details page, there’s more to note…
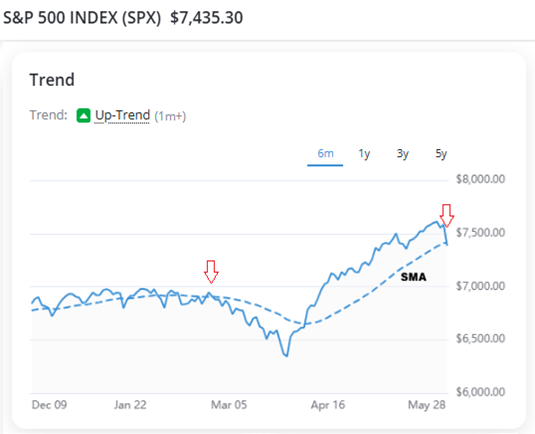
In the chart above, you can see that the S&P 500 remains in an Up-Trend. But last week, the index fell below its Smart Moving Average (SMA), which is another short-term caution sign.
Think of the SMA as a moving average line that best fits the S&P 500’s overall trend. The longer the index’s price is below this key trendline, the more likely we are to see a shift in market trend.
For example, back in March the index fell below its SMA for some time – and the S&P 500 ultimately declined another 9% before rebounding in April.
Of course, it’s far too soon to say if stocks will face another similar drop this time around. After all, back in early December 2025 and late January of this year, the S&P 500 fell below its SMA briefly before rebounding shortly after.
But there’s a growing risk of a downturn that’s important to be aware of.
We’ll have to wait and see, which can be uncomfortable. But one easy way to reduce your stress level amid market uncertainty – and keep close watch on your investments at the same time – is by taking a moment to check in with TradeSmith’s Portfolio Syncing Tool.
Get in Sync with Shifting Markets
By syncing your portfolio, you’ll be able to easily track all of your investments from the comfort of your TradeSmith Finance platform.
That way, you’ll spend less time worrying about the markets and have more time to use our proven tools and strategies to find new opportunities.
Whether you’re a long-term investor or a more active trader, syncing your investment accounts with our user-friendly My Portfolios page on TradeSmith Finance is a quick and easy way to take more control over your finances – with just a few clicks!
Once synced, you can use our TradeSmith tools to:
- Monitor the risks and potential rewards of every asset you own…
- Track performance compared to benchmarks like the S&P 500 or Nasdaq…
- Create personalized alerts to notify you of price changes…
- Rebalance your portfolio, so you don’t take unneeded risks…
- And set protective stops on your investments to help guard against drawdowns.
And it’s super easy to get in sync. Here’s how.
How to Add and Sync Your Portfolio – Quickly and Safely
While you always have the option to manually input your investment details, the fastest – and by far the easiest – way to set up your portfolios is by using our automatic syncing feature.
To sync your brokerage account, simply log into your TradeSmith Finance account to get started.
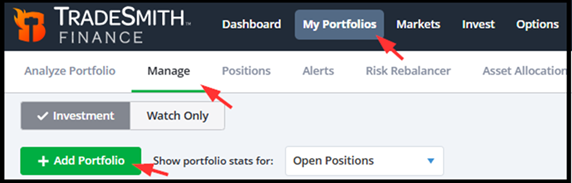
Next, go to the My Portfolios page. From there, select the Manage tab, and then click the green Add Portfolio button to start the syncing process.
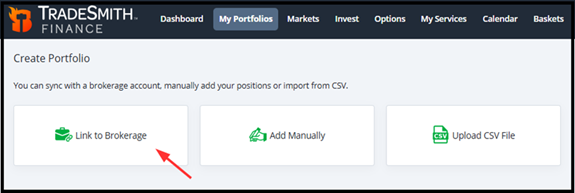
Next, select the Link to Brokerage option. Then click Continue to choose your broker. It’s that easy!
Our portfolio syncing features are handled through Yodlee FastLink – a secure-channel connection service trusted by major banks and brokerage firms.
While we use this service to pull data from your broker account and sync it securely with your TradeSmith Finance platform, there’s no need to worry about your security. None of your personal account credentials will be saved to our servers.
Next, simply select your broker from our list – which features some of the most popular and well-known firms.
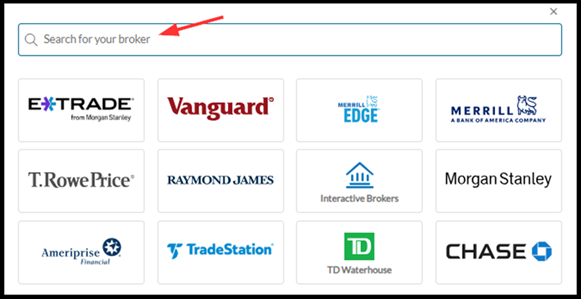
And if you don’t see an icon for your broker, you can always search for your broker on this page by typing your broker’s name into the search bar at the top of the list.
If you can’t find your broker, simply contact our customer support team at [email protected]and we may be able to assist.
After selecting your broker, simply follow the prompts to complete your portfolio sync with your TradeSmith account.
If you’re new to TradeSmith, or just haven’t synced up your portfolio yet, you’ll find more details here. This includes a simple step-by-step process to help ensure all your data is accurately synched.
Once in sync, you can click on the My Portfolios tab anytime to assess your investment performance in real time on the Overview tab:
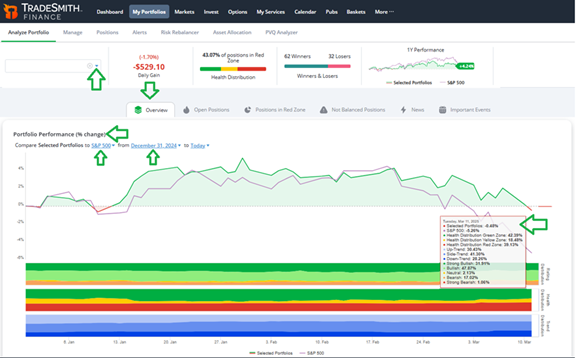
Here you can see at a glance how your investments are tracking vs. the S&P 500.
Plus, scroll down and you can view your portfolio allocation according to our key TradeSmith metrics…
- Health distributions for every position (Green, Yellow, and Red Zone statuses), on both the Short- and Long-Term timeframes,
- Rating distributions of your holdings (ranging from Strong Bullish to Strong Bearish),
- Sector and Industry Allocation,
- And above all, your portfolio Risk Allocation:
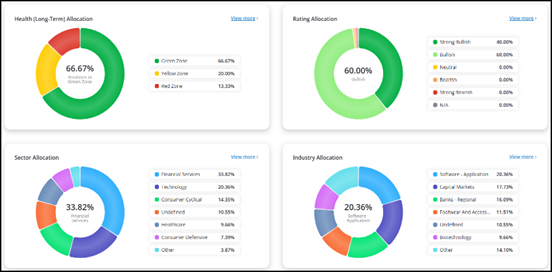
Simply click on the blue View more > option on each window for a more detailed breakdown of your investments.
Next, click on the Open Positions tab to the left of Overview:
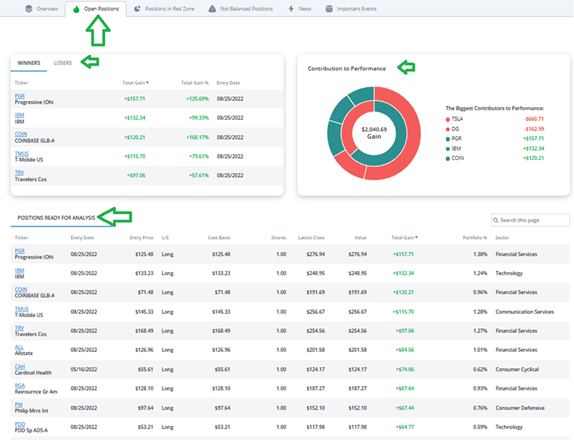
Here you can quickly assess the top winners (and losers) in your portfolio, plus see the biggest contributors to (or detractors from) your performance.
This information can help you easily rebalance your portfolio by trimming underperforming stocks and adding new opportunities with greater upside potential.
Bottom Line: With the stock market suddenly turning more volatile, you’ll want to keep close watch over your investments with TradeSmith’s portfolio syncing tool. It’s the less-stress way to trade and invest by helping you avoid unnecessary risk.
Good investing,
Mike Burnick
Senior Analyst, TradeSmith
P.S. TradeSmith’s portfolio syncing tools can help you monitor changes in your portfolios, no matter how the market moves. And with the caution signs that our Trend and Trade Cycles tools have been sending out lately, that could be all the more important in the coming weeks.
But that’s not to say that you should cower and hide from the markets this summer: Instead, you’ll just need to make sure you’re using the right tools… and timing your trades properly.
Here at TradeSmith, our team of researchers and software developers are constantly working to improve our tools – all to help investors like you maximize their returns no matter the market.
And tomorrow, Wednesday, June 10 at 10:00 a.m. Eastern, we’re taking a step forward to deliver a brand-new tool that will enhance your investing even further.
TradeSmith’s CEO, Keith Kaplan, is stepping forward to unveil a powerful upgrade to the TradeSmith platform that, for my money, couldn’t come at a better time.
It’s a brand-new way to use AI – one that could’ve turned a 292% gain on Broadcom into a 6,284% gain, and a 47% gain on Visa into a 263% gain during our backtests. It even has the potential to turn losing trades into big winners!
Keith believes it could be the most important upgrade to the TradeSmith platform since its founding. And he’s not the only one excited about it, either: Louis Navellier, investment legend and Senior Analyst at our corporate partner InvestorPlace, will be joining him to reveal this new upgrade… and to share a prediction that could change your entire summer.
It’s an event you won’t want to miss.
Click here to save your spot – and get all the details from Keith and Louis at 10:00 a.m. Eastern.